Recommendation System (RecSys)

Mentor: Mr. Sambit Sekhar Project: Recommender Systems
RecSys (Recommender Systems) has become an important component in today's digital world. It’s a vital component of many industries providing e-services ranging from news services(BBC), social media(facebook, twitter, tiktok etc) to online video streaming platforms(netflix, youtube etc).
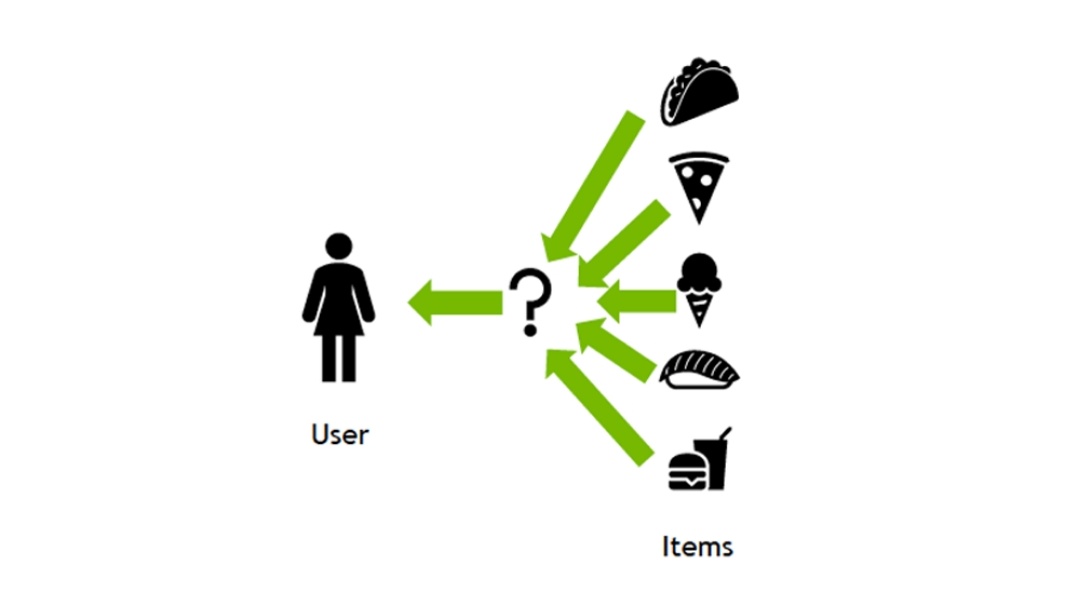
RecSys captures user behaviour information and gives tailored suggestions to the user using a scalable end-to-end pipeline. A recommender system's purpose is to locate the products that are the most clickable (likeable) for a certain user. It accomplishes this by thoroughly evaluating the information acquired from user interactions, such as likes, clicks, watch times, purchases, and session-based product impressions. It should then rank them and show the user the top-N things. It is accomplished by calculating the probability of a certain item being clicked by a specific user. CTRs (Click Through Rate) estimations are the method for doing this.
Project Structure
├── Makefile           <- Makefile with commands like `make data` or `make train`
├── README.md          <- The top-level README for developers using this project.
├── data
│   ├── processed      <- The final, canonical data sets for modeling.
│   └── raw            <- The original, immutable data dump.
│
├── docs               <- A default folder for all Docs.
│
├── models             <- Trained and serialized models, model predictions, or model summaries
│
├── notebooks          <- Jupyter notebooks.
│
│
├── reports            <- Generated analysis as HTML, PDF, LaTeX, etc.
│   └── figures        <- Generated graphics and figures to be used in reporting
│
├── requirements.txt   <- The requirements file for reproducing the analysis environment, e.g.
│                         generated with `pip freeze > requirements.txt`
│
├── setup.py           <- makes project pip installable (pip install -e .) so src can be imported
├── src                <- Source code for use in this project.
│   ├── __init__.py    <- Makes src a Python module
│   │
│   ├── data           <- Scripts to download or generate data
│   │   └── make_dataset.py
│   │
│   ├── features       <- Scripts to turn raw data into features for modeling
│   │   └── build_features.py
│   │
│   ├── models         <- Scripts to train models and then use trained models to make
│   │   │                 predictions
│   │   ├── predict_model.py
│   │   └── train_model.py
│   │
│   └── visualization  <- Scripts to create exploratory and results oriented visualizations
│       └── visualize.py
|
Objective
Imagine that you all are part of a digital news startup as a ML engineer, to increase CTRs (Click through Rate) on news website, CEO makes the decision to opt for a recommendation system. By opting for Recsys users will be able to get highly personalized and more relevant news article, by which users will spend more time on reading more news. This will help news website to increase web traffic and can act as a marketing tool.
So you need to implement
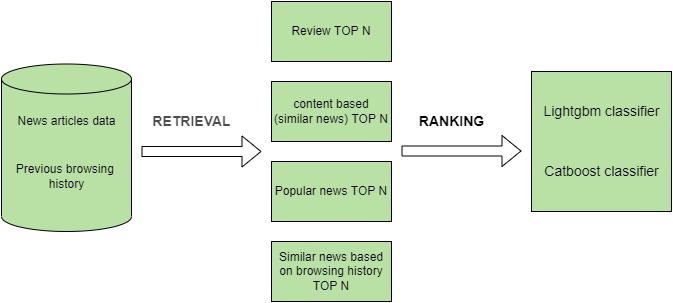
- Top N popular news at a certain time interval.
- Top N review news, showing news which user have not read
- Top N content based(similar news). As eg If someone read about “tsunami due to climate change” then recommended news will be regarding “tsunami and climate change”.
- Top N news based on past transactions. All users have a unique trend of reading, like if someone have trend of reading first sport news -> then political news -> then bollywood news. Then other users start with sports news then our algo must recommend the other two(political, bollywood).
At last we will use Ranking Algorithm to make more personalized recommendations for specific user.
You can showcase your project by using streamlit.
Overview regarding Project
In this Project, we need to develop News recommendations based on data from previous transactions, as well as from product meta data. The available meta data description can be find inside docs folder and
News Recommendation System Workflow

Dataset Format
Both the training and validation data are a zip-compressed folder, which contains four different files:
| File Name | Description |
|---|---|
| behaviors.tsv | The click histories and impression logs of users |
| news.tsv | The information of news articles |
| entity_embedding.vec | The embeddings of entities in news extracted from knowledge graph |
| relation_embedding.vec | The embeddings of relations between entities extracted from knowledge graph |
behaviors.tsv
The behaviors.tsv file contains the impression logs and users' news click hostories. It has 5 columns divided by the tab symbol:
- Impression ID → The ID of an impression.
- User ID → The anonymous ID of a user.
- Time → The impression time with format "MM/DD/YYYY HH:MM:SS AM/PM".
- History → The news click history (ID list of clicked news) of this user before this impression. The clicked news articles are ordered by time.
- Impressions → List of news displayed in this impression and user's click behaviors on them (1 for click and 0 for non-click). The orders of news in a impressions have been shuffled.
An example is shown in the table below:
| Column | Content |
|---|---|
| Impression ID | 91 |
| User ID | U397059 |
| Time | 11/15/2019 10:22:32 AM |
| History | N106403 N71977 N97080 N102132 N97212 N121652 |
| Impressions | N129416-0 N26703-1 N120089-1 N53018-0 N89764-0 N91737-0 N29160-0 |
news.tsv
The docs.tsv file contains the detailed information of news articles involved in the behaviors.tsv file.
It has 7 columns, which are divided by the tab symbol:
- News ID
- Category
- SubCategory
- Title
- Abstract
- URL
- Title Entities (entities contained in the title of this news)
- Abstract Entities (entities contained in the abstract of this news)
The full content body of MSN news articles are not made available for download, due to licensing structure. However, for your convenience, we have provided a utility script to help parse news webpage from the MSN URLs in the dataset. Due to time limitation, some URLs are expired and cannot be accessed successfully. Currently, we are trying our best to solve this problem.
An example is shown in the following table:
| Column | Content |
|---|---|
| News ID | N37378 |
| Category | sports |
| SubCategory | golf |
| Title | PGA Tour winners |
| Abstract | A gallery of recent winners on the PGA Tour. |
| URL | https://www.msn.com/en-us/sports/golf/pga-tour-winners/ss-AAjnQjj?ocid=chopendata |
| Title Entities | [{"Label": "PGA Tour", "Type": "O", "WikidataId": "Q910409", "Confidence": 1.0, "OccurrenceOffsets": [0], "SurfaceForms": ["PGA Tour"]}] |
| Abstract Entites | [{"Label": "PGA Tour", "Type": "O", "WikidataId": "Q910409", "Confidence": 1.0, "OccurrenceOffsets": [35], "SurfaceForms": ["PGA Tour"]}] |
The descriptions of the dictionary keys in the "Entities" column are listed as follows:
| Keys | Description |
|---|---|
| Label | The entity name in the Wikidata knwoledge graph |
| Type | The type of this entity in Wikidata |
| WikidataId | The entity ID in Wikidata |
| Confidence | The confidence of entity linking |
| OccurrenceOffsets | The character-level entity offset in the text of title or abstract |
| SurfaceForms | The raw entity names in the original text |
Getting started with project
- Clone project repository using GIT CLI.
command for it -
git clone https://github.com/odisha-ml/odisha-ml.github.io.git - In terminal go inside mini-project directory using "cd" command. COMMAND -
cd odisha-ml.githubio/docs/mini-projects/FDP2022/mp11/ - Activate Anaconda enviroment in your system. If you don't have follow this link to download and activate environment. link
- Please extract data from zip folder present in
data->raw. - Then run jupyter server using this command -
jupyter notebook